When Jinah Kim learned in 2016 that Museum of Fine Arts conservation scientist Michele Derrick had detected cobalt in a 15th-century Indian manuscript, she was presented with an obvious explanation: the document had probably been retouched later, potentially with synthetic pigments. After all, European-made cobalt-based pigments like smalt were widely imported to South Asia only in the 17th century, and synthetic cobalt blue was popularized only in the early 19th century.
But Kim, who was gathering data on pigments as research for her second book, wasn’t convinced.
“What do we know about actual pigment usage in this region at this time period?” Kim, George P. Bickford Professor of Indian and South Asian Art in the Department of History of Art & Architecture, asked herself. “Does it all have to come from Europe? It’s possible there are indigenous knowledge of colorants that we don’t know about.”
Further analysis by Katherine Eremin, Patricia Cornwell Senior Conservation Scientist at Harvard Art Museums, confirmed that the smalt found in the Jain manuscript had a different composition from European-manufactured smalt, indicating it came from a different source.
It was a “eureka” moment for Kim, who hypothesized that some pigments believed to have gotten to South Asia as imports from Europe may in fact have been used in South Asia long before. The result was the “Mapping Color in History Project,” an ongoing effort since 2018 to create an object-based pigment database for historical research on art from this region.
“I realized a lot of pigment databases available out there are based on a Western European canon, because that’s where the research has been,” Kim said. “If you look at Asian materials, especially South Asia, Himalaya, and Southeast Asia, everything is so colorful but the baseline understanding of what colorants were available is not known.”
“I realized a lot of pigment databases available out there are based on a Western European canon, because that’s where the research has been.”
Jinah Kim
The open-access database allows users to search by painting title, keyword, pigment, color, or element, and filter results by artist, date, and more. There’s also a map to search by location of origin. On each artwork’s page, users can view an analysis of what pigments were found in the painting, what method was used to identify them, and the scientists’ confidence level. Kim wants the database to be useful for “anyone interested in color,” including people in the cultural heritage field, art historians, curators, teachers, and students.
Kim describes Mapping History as highly collaborative, bringing together experts in digital humanities, conservation science, and art history.
“I do describe it as a three-legged stool,” Kim said. “It cannot be done by one person because it requires a lot of different expertise. You need to do computer programming to make this database, you need to work with material analysis, and you need art historical research to map it in history and time.”
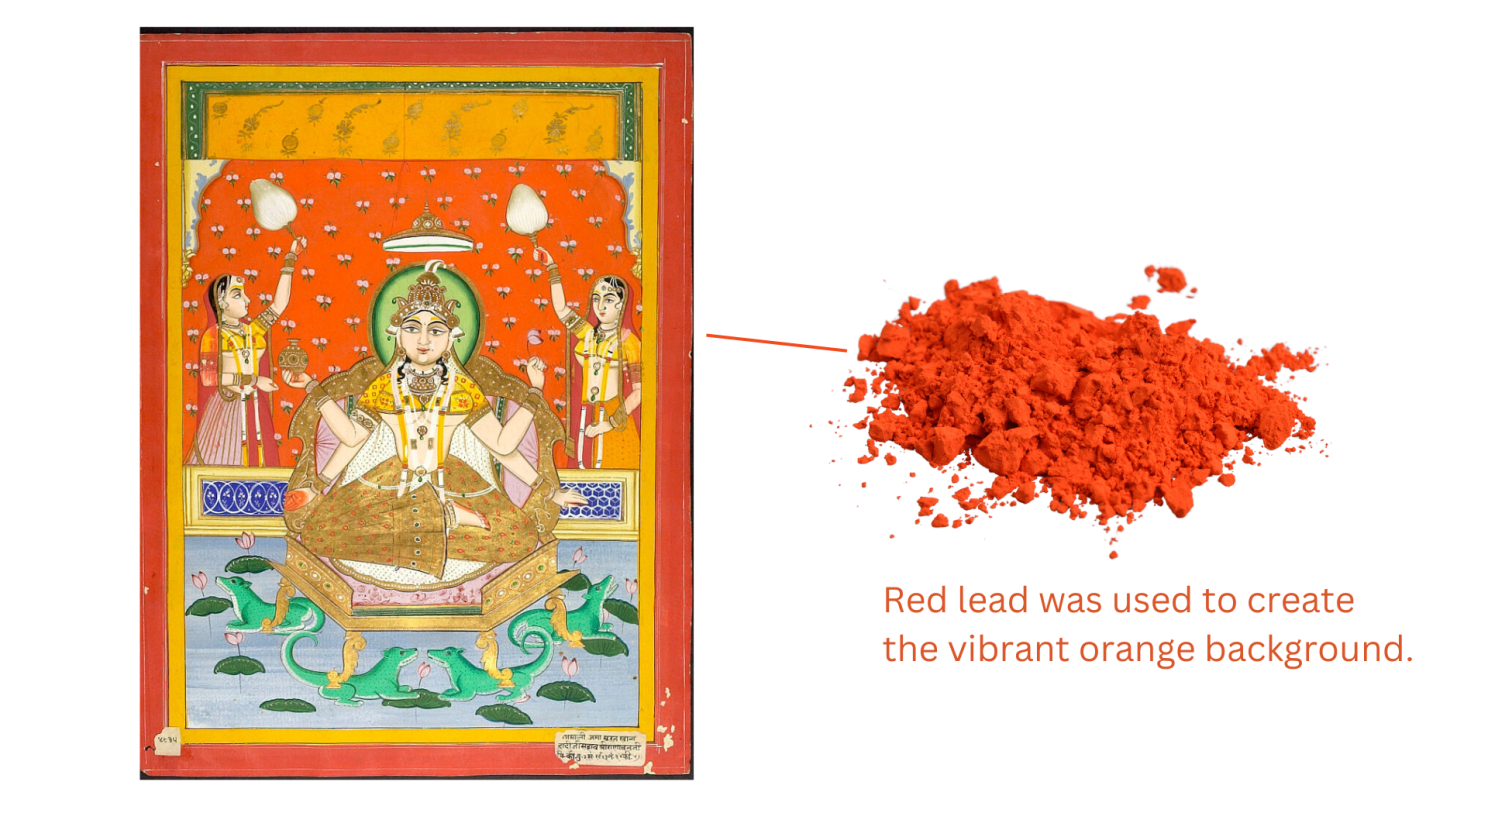
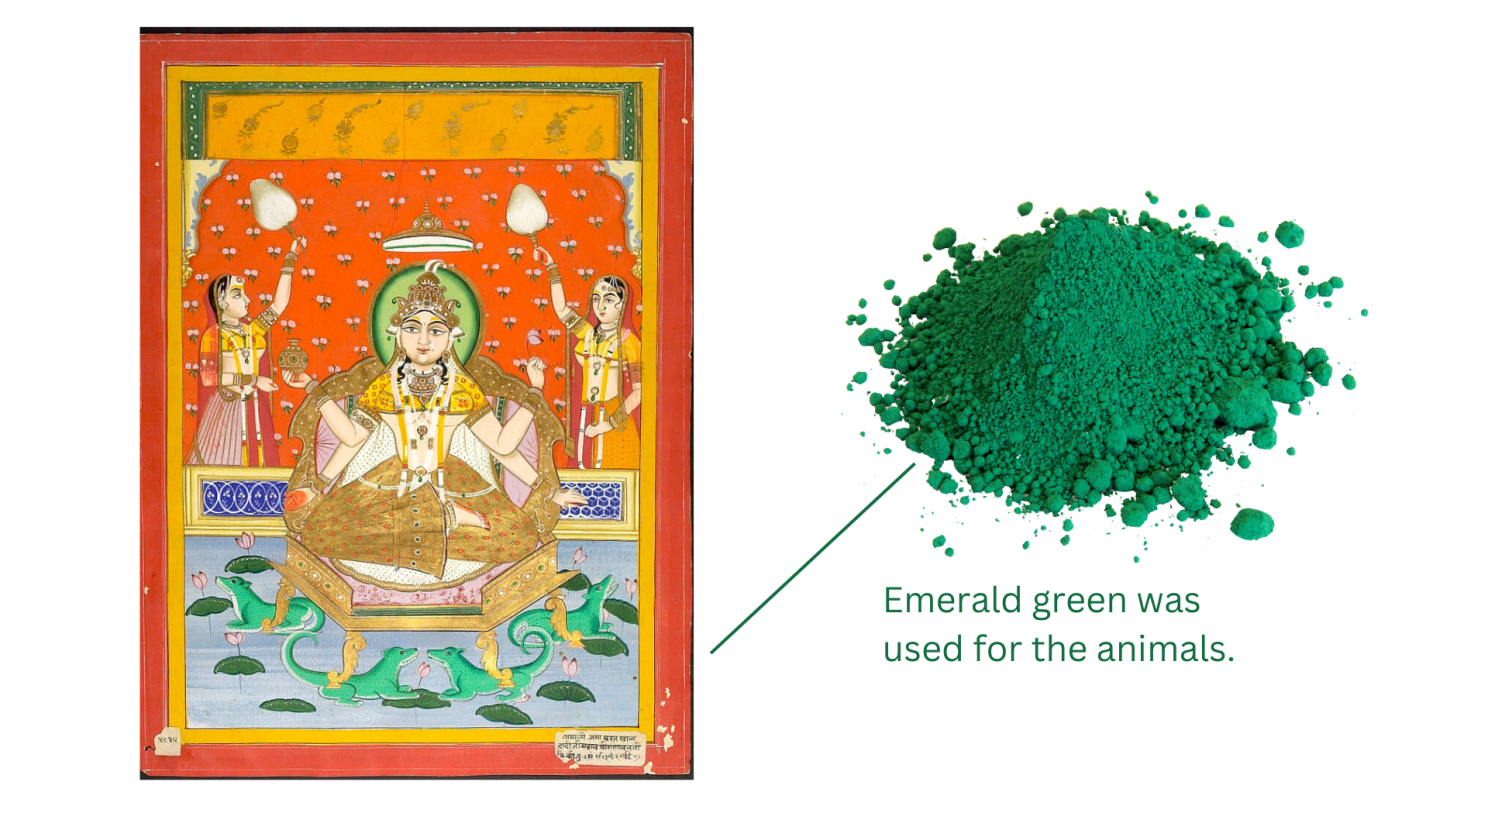
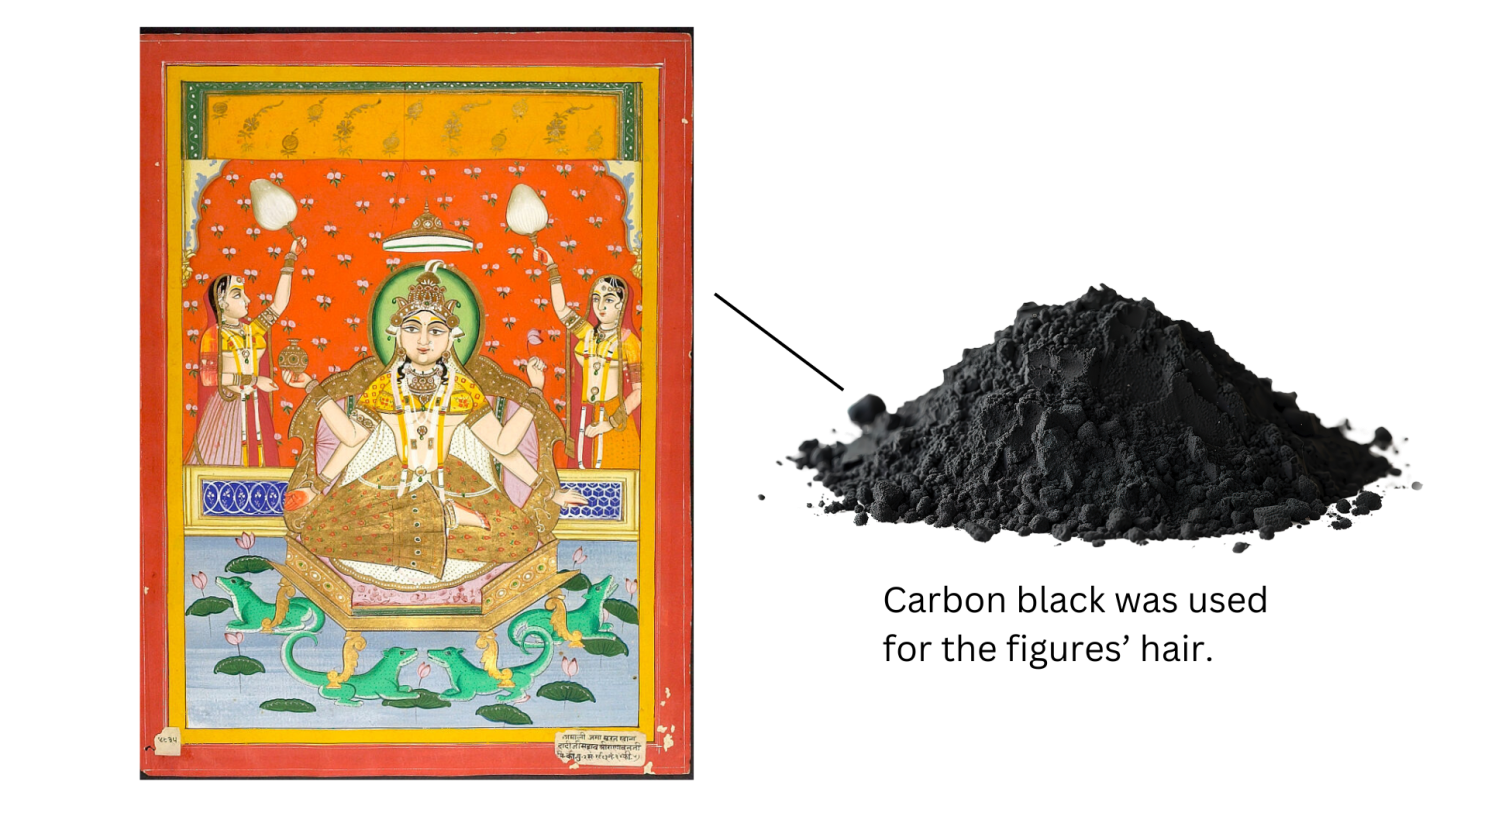
“Hindu Goddess Ganga with Two Female Attendants Carrying Fly-Whisks,” Harvard Art Museums/Arthur M. Sackler Museum, Gift of James E. Robinson III in honor of Stuart Cary Welch and Alve John Erickson
Photo © President and Fellows of Harvard College, 1997.236
Kim worked with Rashmi Singhal and the Arts & Humanities Research Computing (DARTH) team and Jeff Steward from Harvard Art Museums on the technology aspects of the project. The database was built from scratch.
Tracy Stuber, digital humanities specialist with DARTH who acts as bridge between the research teams and software engineers, said the Mapping Color website is unique because it links two types of data that are usually siloed and used by separate audiences: data about the artwork itself and data about the scientific analysis.
“Because we know approximately where or when an artwork was made, we’re then able to say, ‘This pigment that we’ve identified in this artwork was therefore made approximately in that place at that time,’” Stuber said. “Linking them together in a database not only makes that data accessible to the other audience but facilitates more collaboration and conversation between those two disciplines.”
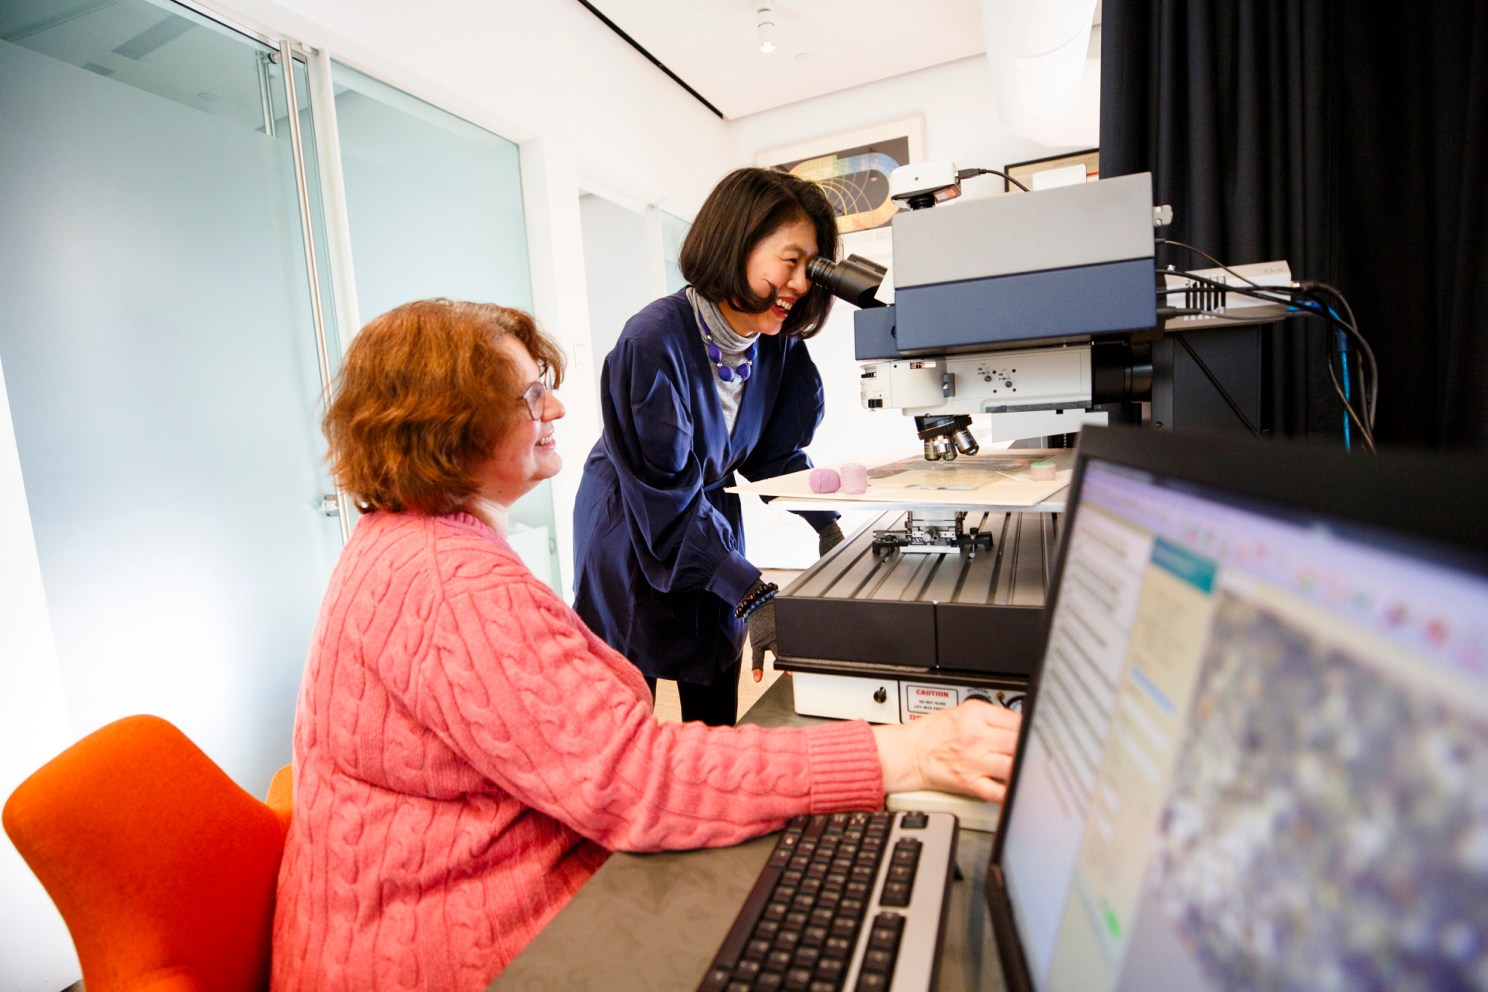
Katherine Eremin (left) and Jinah Kim observe a manuscript under a microscope.
Photos by Grace DuVal
Working with ancient art means that scientists can’t usually take samples for analysis. Mapping Color’s scientists rely 99% of the time on non-destructive methods, according to Eremin, who is one of the project’s core partners.
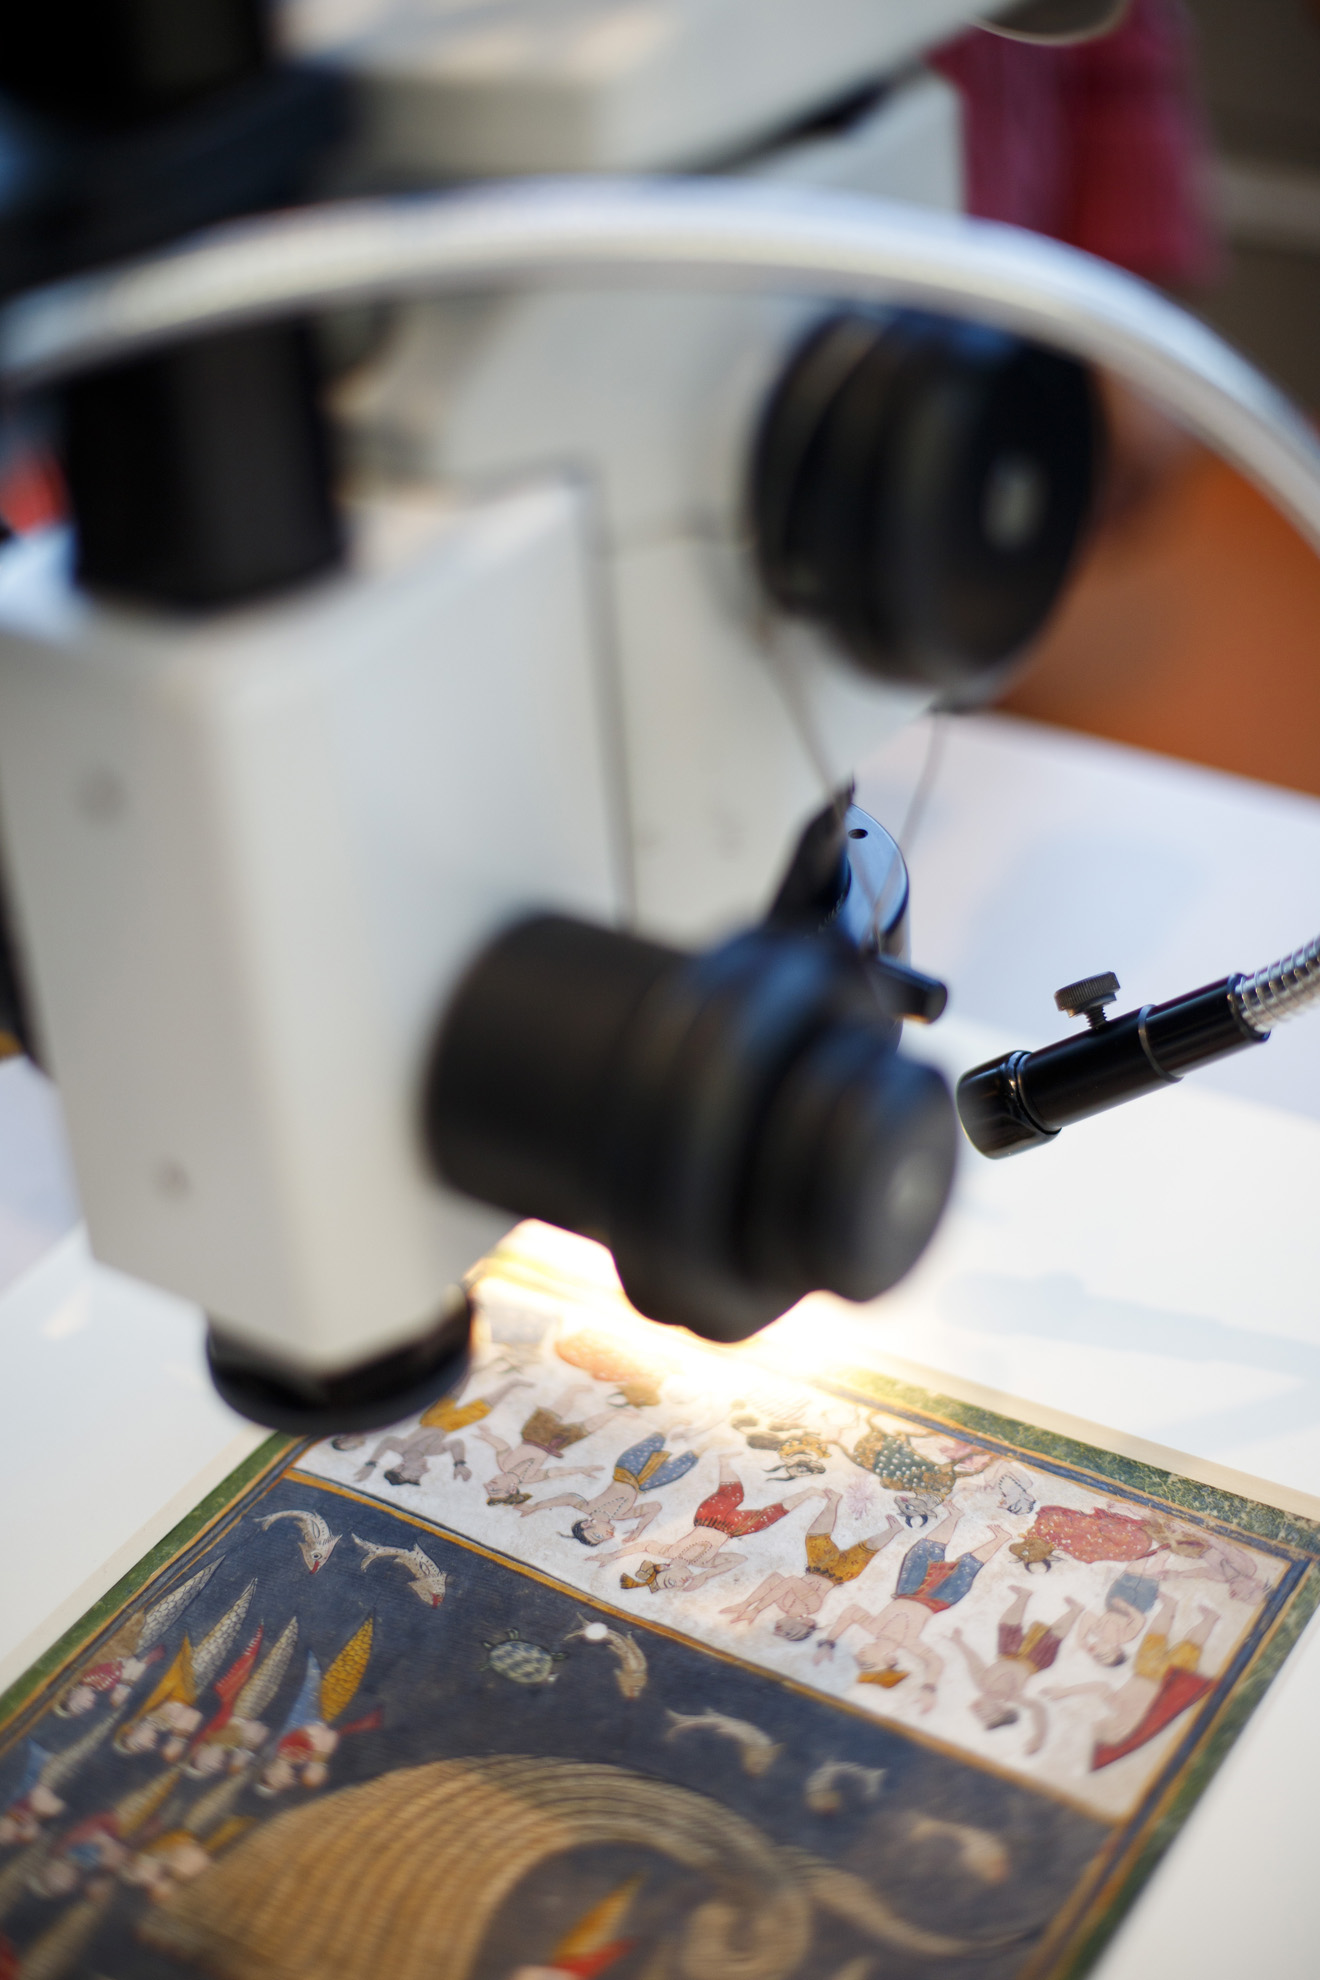
When Eremin analyzes an artwork, she typically starts with imaging which can identify certain pigments that behave differently in infrared and ultraviolet lights. Indian Yellow, for example, glows under UV light. She also examines the pigment under a microscope to see the blend of colors used.
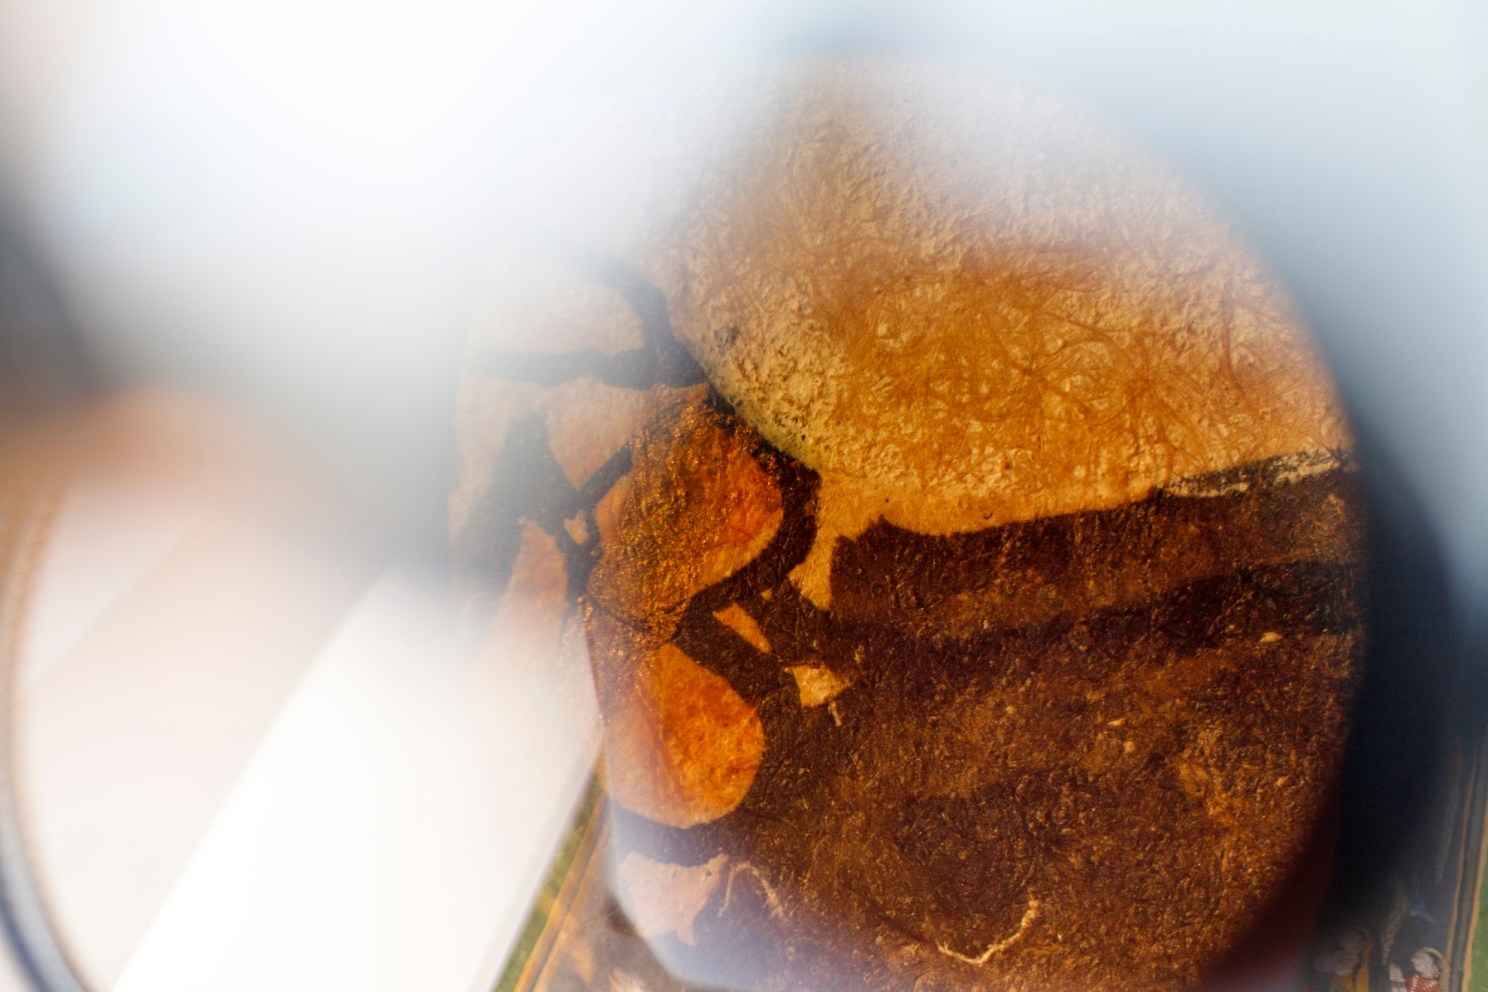
“You look at them to begin with and you think, ‘Oh that’s beautiful,’ but then you actually look down the microscope and see the really fine details,” she said. “You think, ‘that’s just blue,’ and then you look at it and see that actually it’s lots of different things mixed together.”
She will then try to identify elements using x-ray fluorescence to see what characteristic x-rays are emitted from the painting. For example, a green can be identified as copper green if there are visible copper rays, or yellow orpiment (an arsenic sulfide mineral) blended with blue if there are visible arsenic rays. To gather information at the molecular level, Eremin uses Raman spectroscopy, a non-invasive laser technology which can reveal if a copper green is either malachite or atacamite.
On rare occasions if an artwork is already flaking, it may begin a conversation between conservators, curators, and scientists about whether to take a sample. Eremin used an infrared light technique known as Fourier-Transform Infrared Spectroscopy on one tiny particle taken from a crumbling 16th-century Indian manuscript, and identified that kaolin clay was used for the white border detail.
The findings give insight into the vision of the artists. In an analysis of a 1588 “Divan of Anvari” manuscript series, Mapping Color scientists realized the artist used an Indian yellow pigment for the pure yellow of figure’s clothing, but used orpiment, an older arsenic sulfide yellow, for highlighting leaves on a tree.
“What that tells me is that artists are trying to get to that pure form of brilliant yellow, and they’re discerning between different shades,” Kim said.
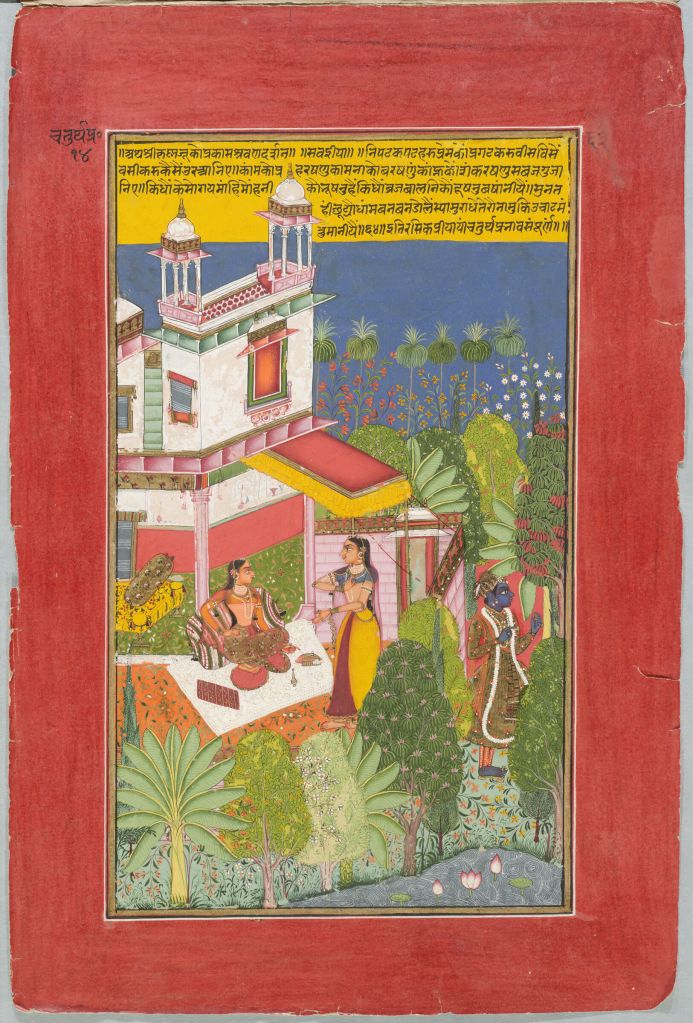
“Krishna’s Manifest Vision through Sound (Kavitt),” from a Rasikapriya series, Harvard Art Museums/Arthur M. Sackler Museum, Gift of Philip Hofer
Photo © President and Fellows of Harvard College, 1984.458
The Mapping Color in History Project has also collaborated with Jaipur-based traditional Indian painter Babulal Marotia to analyze samples of pigments he uses in his studio. It’s helpful to study materials used by contemporary artists like Marotia, who are carrying on artistic traditions that have been passed down for generations, according to Kim.
“You can’t dissolve a 700-year-old painting to see what has happened.” Kim said. “This gives us an access point to that historical moment through this type of material that’s still being used.”
Mapping the origin locations of the paintings in the database isn’t easy, as historic paintings from South Asia often lack precise information about the date, location, and artist.
Mapping the origin locations of the paintings in the database isn’t easy, as historic paintings from South Asia often lack precise information about the date, location, and artist.
“If you look up certain Indian painting in a museum’s database, it will say, ‘North India, 17th-18th century,” Kim said. “You cannot map “North India, 17th -18th century” in any point in time and place. That’s where we need to do more research on objects, find more relevant information and answer comparative studies to narrow it down and come up with better attribution.”
Kim has a list of ideas for how to improve the database (adding more artworks, visualization tools, and certainty indicators) that she is excited to implement.
“I want to understand certain trends, I want to be able to see patterns, I want to see things that were not visible before,” Kim said. “But a database is only as good as the data itself, so there’s a lot of work that still needs to go in.”
Some of the work on the database was supported by grants from the National Endowment for the Humanities.
Source link